Observability for Ruby on Rails with OpenTelemetry
When building an application, it’s natural to focus on features and requirements. But once the app reaches real users, the feedback often shifts to performance: "This is too slow!" What worked seamlessly on your development machine can behave very differently in production.
That’s where OpenTelemetry comes in. By capturing critical insights throughout development, testing, and live environments, it gives you the visibility needed to pinpoint bottlenecks and fine-tune performance. The result? Applications that not only deliver the right features but also meet user expectations for speed and reliability.
At Digitize, we view telemetry as a cornerstone of building great software. It’s what allows us to ship Rails applications that are both feature-rich and consistently smooth for every user.
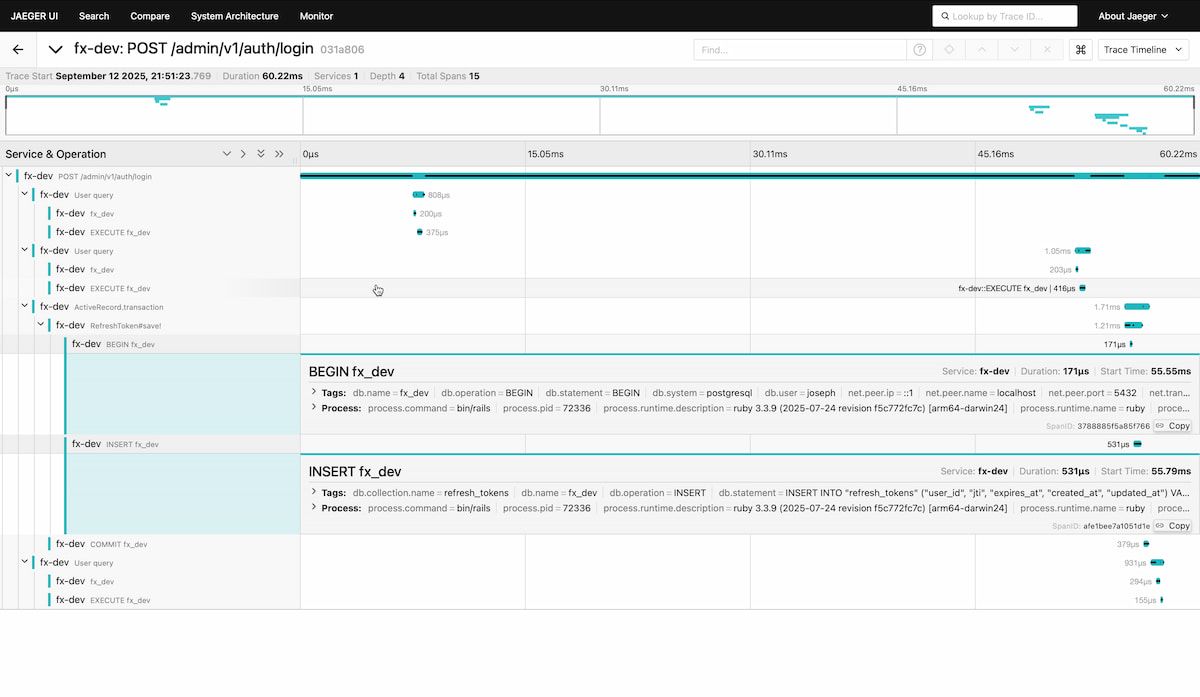
This guide will be a quick one to show you how you can quickly get a Dashboard like the following that shows you important information.
Install required plugins
bundle add opentelemetry-sdk opentelemetry-instrumentation-all opentelemetry-instrumentation-all
bundle install
Create an initializer
# config/initializers/opentelemetry.rb
require 'opentelemetry/sdk'
require 'opentelemetry/instrumentation/all'
require 'opentelemetry-exporter-otlp'
OpenTelemetry::SDK.configure do |c|
  c.service_name = ENV['TELEMETRY_NAME']
  c.use_all()
end
We set the service name using environment variables so we can have different names per environment.
Launch Jaeger
There are many different platforms for viewing telemetry data, but Jaeger is one of the easiest to set up and run locally. It provides a clear interface for visualizing traces, making it a great starting point when you’re first exploring OpenTelemetry. Jaeger Github
docker run --rm --name jaeger \
  -p 4318:4318 \
  -p 16686:16686 \
  jaegertracing/all-in-one:latest
4318 is the HTTP port
16686 is the web UI
You can access on http://localhost:16686
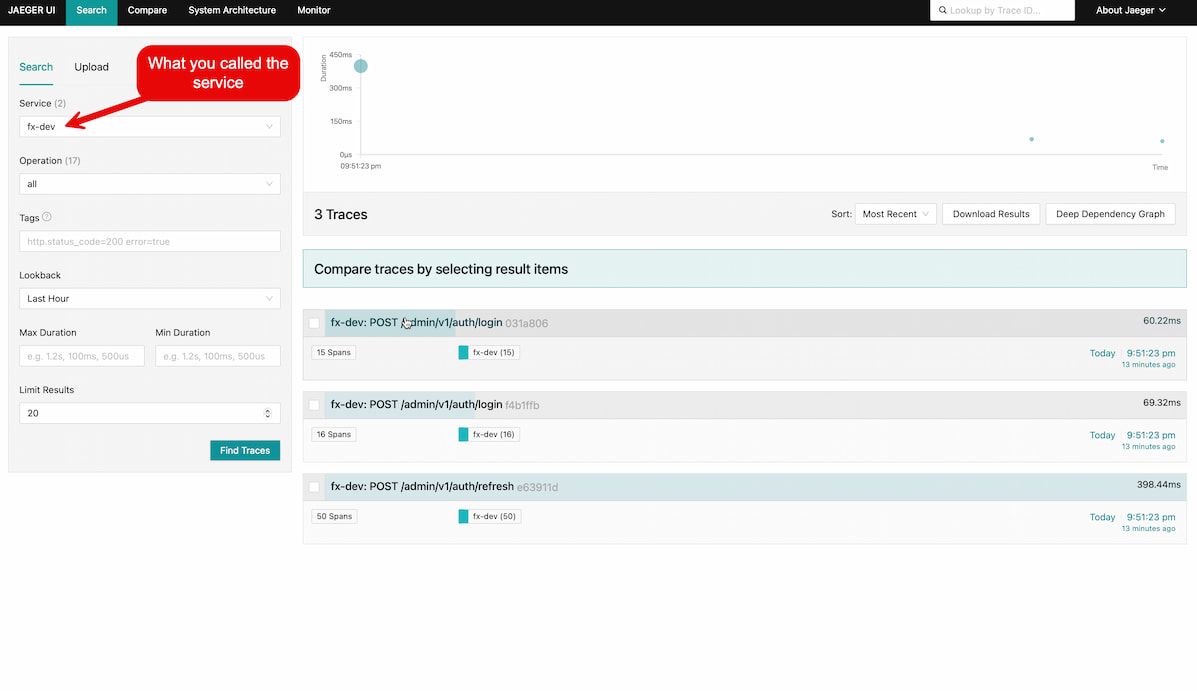
This will give you a web UI like the following
That's it!
With OpenTelemetry installed in your Rails application, you’re ready to see it in action. Start your app, visit a page to generate some traffic, and then open http://localhost:16686 in your browser. From there, select your service and explore the traces — you’ll be able to follow requests end-to-end and uncover what’s really happening under the hood.